> ## Documentation Index
> Fetch the complete documentation index at: https://docs.pensiv.so/llms.txt
> Use this file to discover all available pages before exploring further.

# Relationship graph

> The relationship graph draws documents, sheets, and plotboards as connected nodes. How to read it, filter it, and open a file from a node.

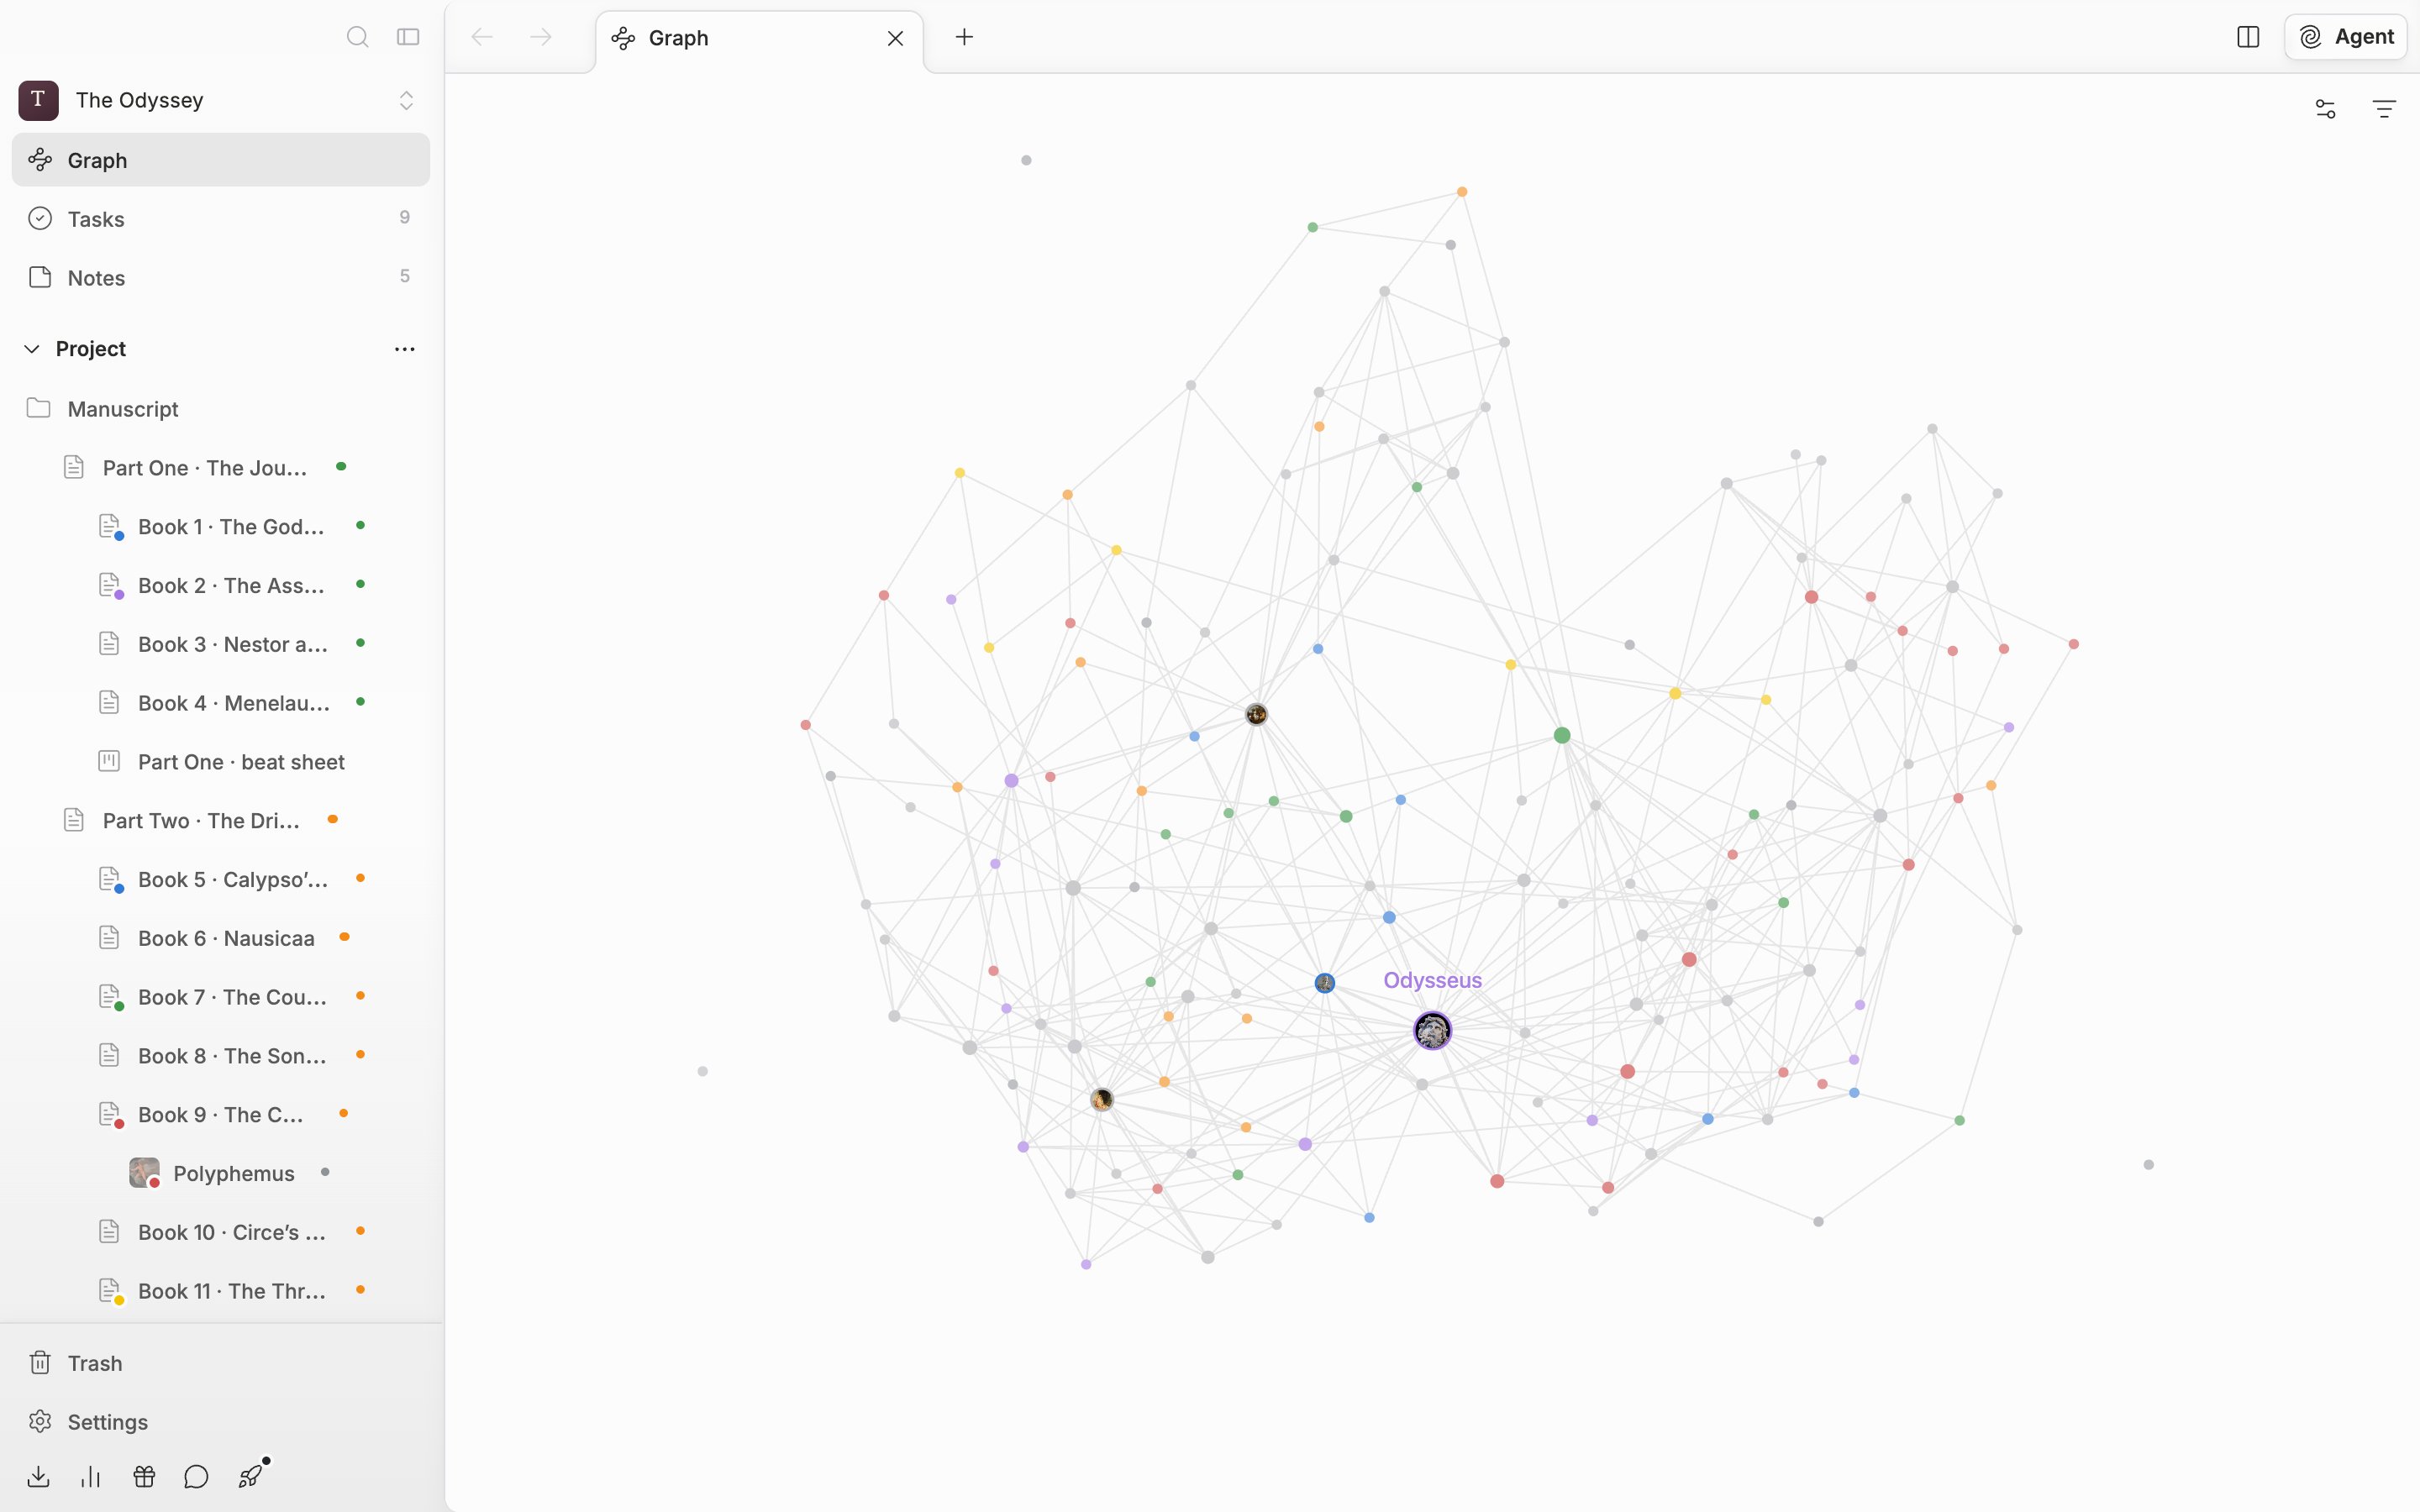
Click "Graph" at the top of the sidebar and the project's files spread out as dots, with the relationships between them as lines. You do not draw the lines by hand; they arise from three places. First, when a document or sheet body mentions another file with `@`. Second, when a file is attached to a sheet's link property (things like "Related Documents", "Related Character", "Related Location") — this one is stored both ways. Third, containment — a plot card attaches to its plotboard, a part card to its plot card, and a child file to its parent. This is drawn even with no mentions at all. The arrow always points from the side the relationship started on to the side it was attached to, so even a two-way relationship carries only one arrow.

<div className="app-window block dark:hidden">
  <img src="https://mintcdn.com/raumlabsinc/ENyX88kfW0HMrWQi/images/en/structure/graph--01.png?fit=max&auto=format&n=ENyX88kfW0HMrWQi&q=85&s=395da6c15f5b2cbfa5f2726b51c1a110" alt="About twenty nodes have settled into place, and the cursor rests on a heavily connected sheet node, so that node, its neighbors, and their edges are bright while the rest are dimmed. The gear and funnel icons at the top right are inside the frame." width="2880" height="1800" data-path="images/en/structure/graph--01.png" />

  <b className="app-mark" style={{ left: '5%', top: '20%' }}>1</b>
</div>

<div className="app-window hidden dark:block">
  <img src="https://mintcdn.com/raumlabsinc/ENyX88kfW0HMrWQi/images/en/structure/graph--01-dark.png?fit=max&auto=format&n=ENyX88kfW0HMrWQi&q=85&s=e80e6e6ae4ab332e2522527cb38ed3f9" alt="About twenty nodes have settled into place, and the cursor rests on a heavily connected sheet node, so that node, its neighbors, and their edges are bright while the rest are dimmed. The gear and funnel icons at the top right are inside the frame." width="2880" height="1800" data-path="images/en/structure/graph--01-dark.png" />

  <b className="app-mark" style={{ left: '5%', top: '20%' }}>1</b>
</div>

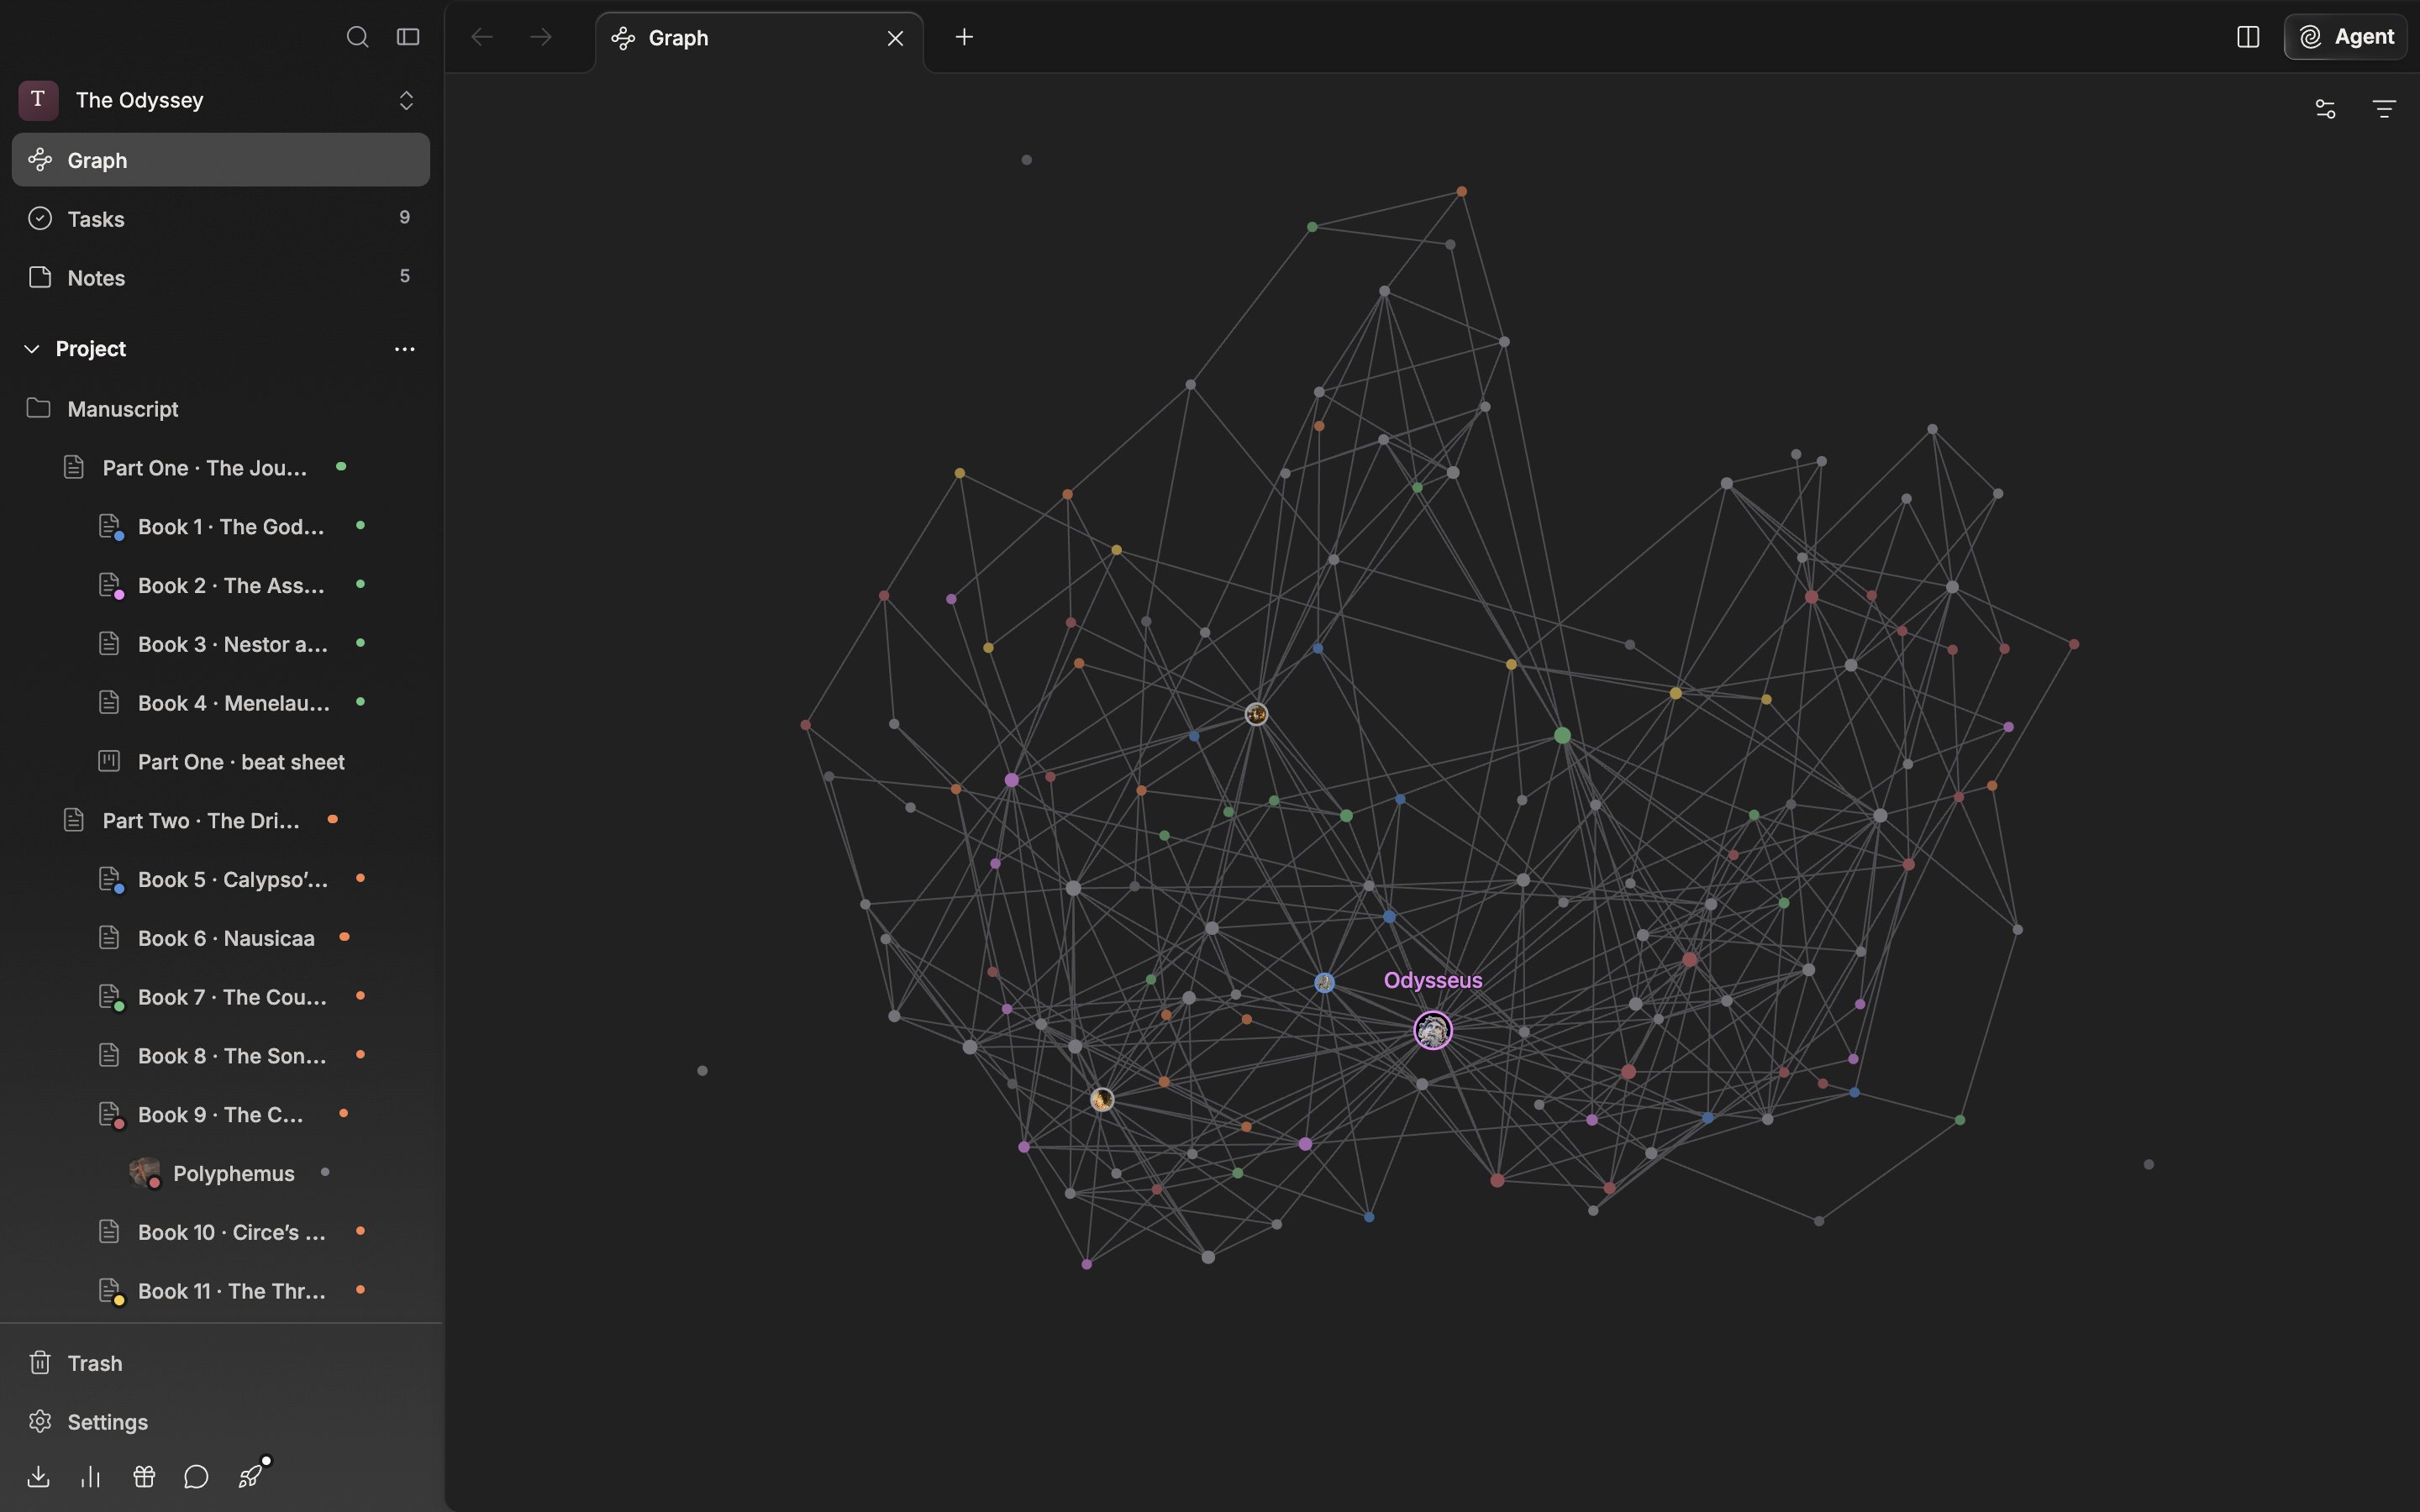
<p className="app-caption">Hover a node and only that file and its neighbors remain.</p>

## How to read it

Node size follows the number of connections. The least connected file is drawn at half the size you set, the most connected at three times. If they all have the same count, they are all the same size. Hover and only that node, its neighbors, and the lines joining them brighten, while the rest recede. The file open in the current pane stands out the same way, and the graph moves the view to that node.

Titles appear and disappear with the zoom level. The further out you go, the more it is only the heavily connected files that keep their names, and past a point they all disappear. The titles of the hovered node and of the open file stay regardless of zoom.

Click a node and that file opens in the current pane. For plot cards and plot part cards, the plotboard the card belongs to opens. Drag a node and drop it and it stays where you dropped it.

## Filtering by type

Click the funnel icon at the top right for six types: Documents, Sheets, Plotboards, Folders, Plot Cards, and Plot Part Cards. Uncheck one and that type drops out of the graph. "Select All" and "Deselect All" reset them in one go. This selection is released when you leave the screen, so everything is on again when you come back.

## Graph Settings

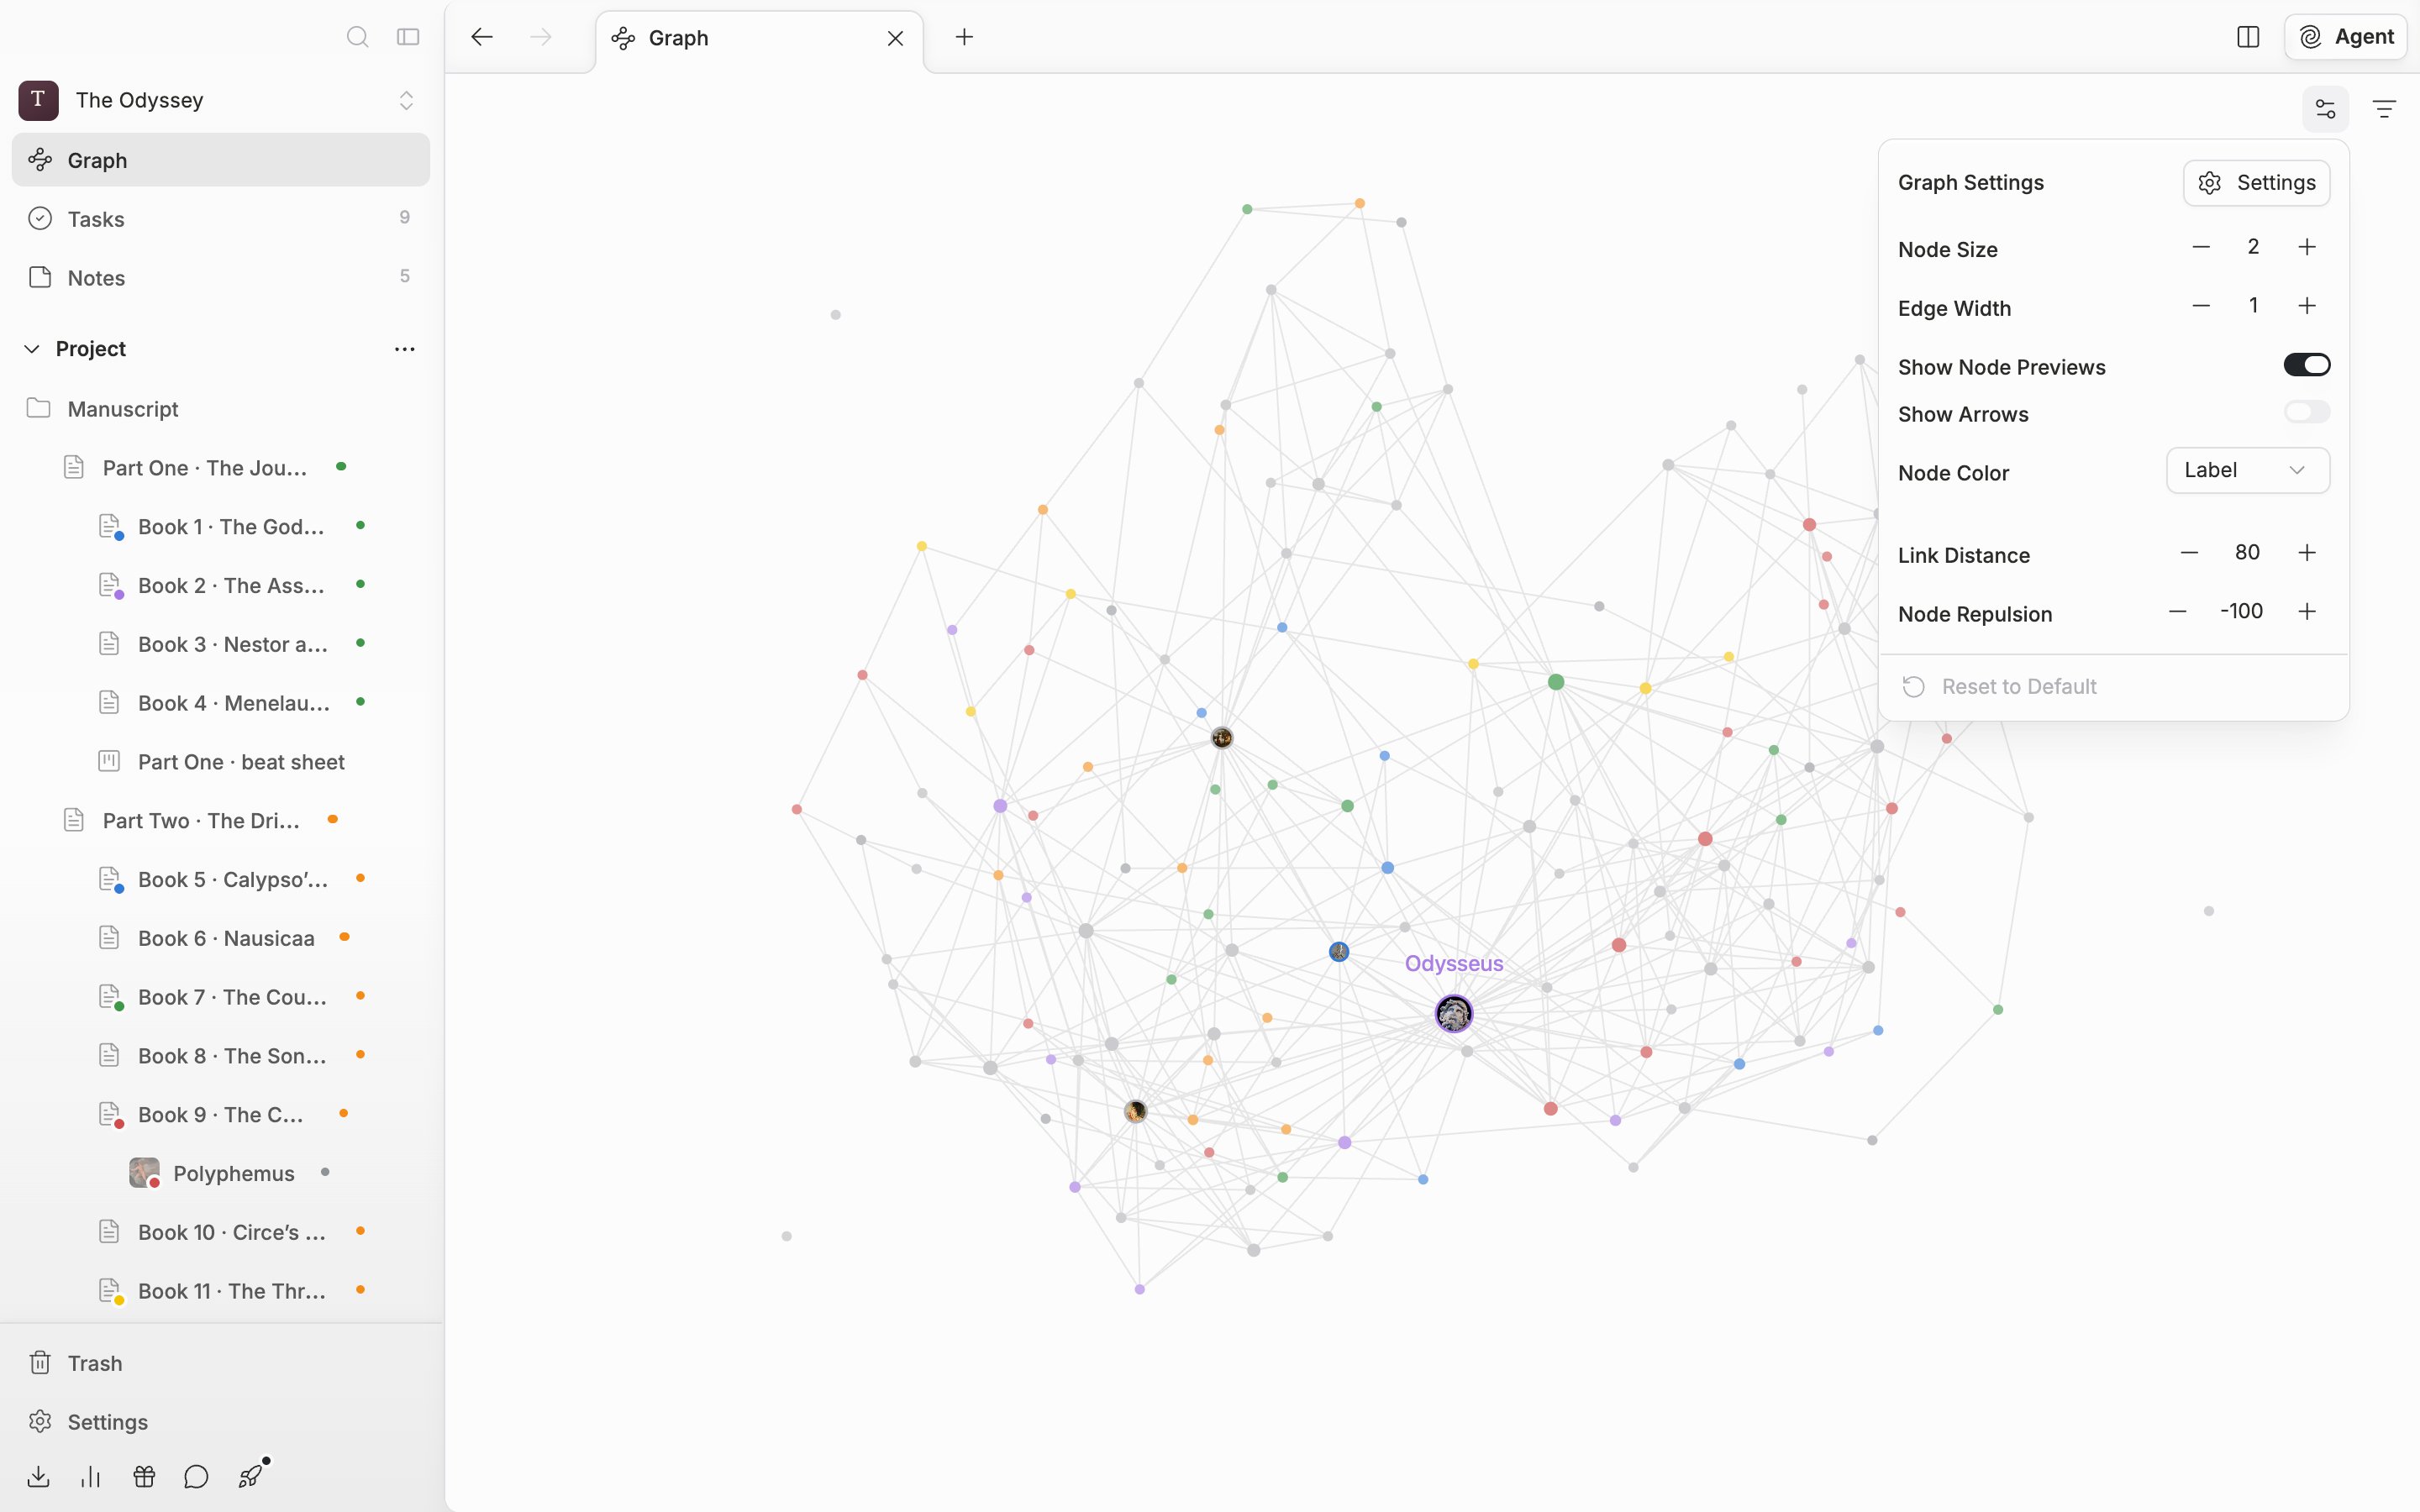
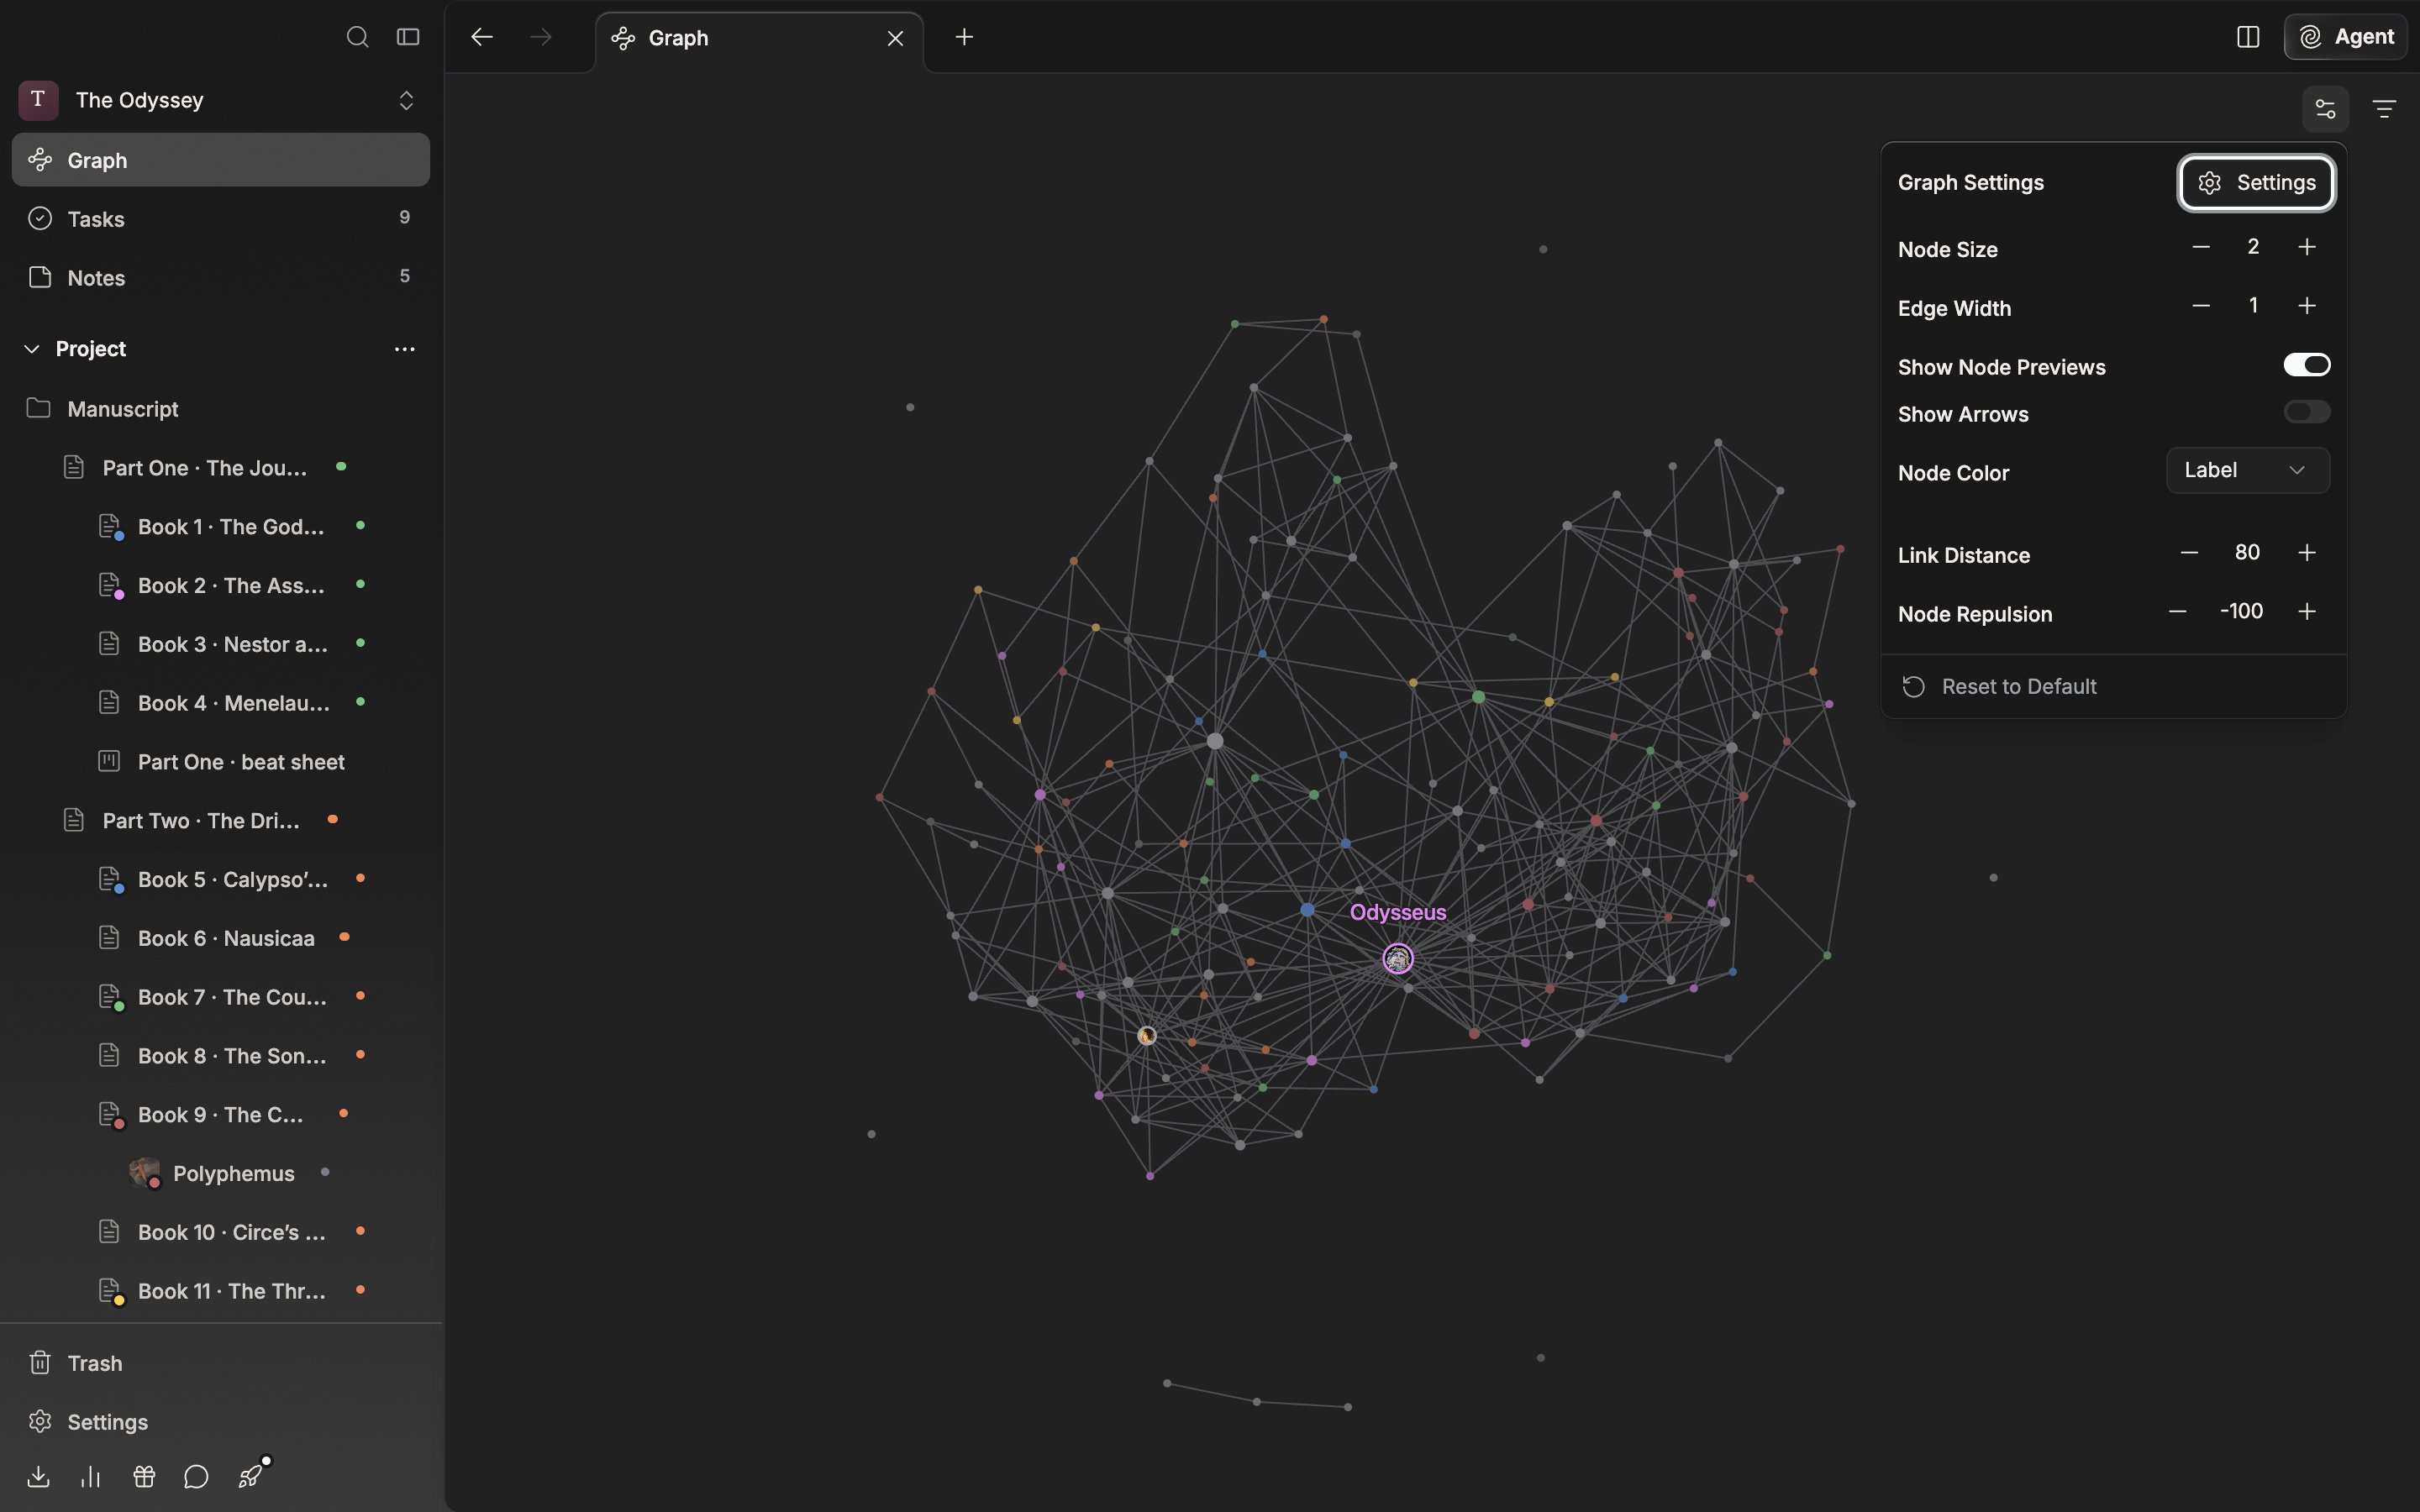
Click the gear icon to open "Graph Settings". **Node Size** and **Edge Width** set how thick the dots and lines are; **Link Distance** and **Node Repulsion** set how far the layout spreads. Turn on **Show Node Previews** and file icons and sheet portraits are drawn instead of plain dots. **Show Arrows** turns the direction arrows at the ends of the lines on and off. **Node Color** is picked from "Label", "Status", and "None". Pick label or status and the node and its title take on that color.
<div className="app-window block dark:hidden">
  <img src="https://mintcdn.com/raumlabsinc/ENyX88kfW0HMrWQi/images/en/structure/graph--02.png?fit=max&auto=format&n=ENyX88kfW0HMrWQi&q=85&s=1ea9f905ca0bc26f32529f0b9ef75020" alt="The gear at the top right has been clicked and the graph settings popover is open. Node Size, Edge Width, Show Node Previews, Show Arrows, Node Color, Link Distance, and Node Repulsion are all visible in one screen, and “Reset to Default” at the bottom is not cut off." width="2880" height="1800" data-path="images/en/structure/graph--02.png" />
</div>

<div className="app-window hidden dark:block">
  <img src="https://mintcdn.com/raumlabsinc/ENyX88kfW0HMrWQi/images/en/structure/graph--02-dark.png?fit=max&auto=format&n=ENyX88kfW0HMrWQi&q=85&s=15dd78e9e99e42c75b46dd2b9f5e7803" alt="The gear at the top right has been clicked and the graph settings popover is open. Node Size, Edge Width, Show Node Previews, Show Arrows, Node Color, Link Distance, and Node Repulsion are all visible in one screen, and “Reset to Default” at the bottom is not cut off." width="2880" height="1800" data-path="images/en/structure/graph--02-dark.png" />
</div>

<p className="app-caption">Change a value and it shows up right away in the graph behind it.</p>

"Reset to Default" at the bottom returns every value to its original and also releases the nodes you pinned by dragging. Pins release whenever you touch a layout value, for the same reason.

The "Settings" button at the top of the popover opens the Graph tab in the settings window. It adds "Center Force", which pulls nodes toward the center, and "Radial Force", which holds them inside a boundary, and every entry carries a description. Graph settings apply to the whole account, not per project.
