

Choose what to count first
Two toggles sit at the right of the heading, and they govern the whole screen. The left one is the counting method. Net, the default, is the characters you typed minus the characters you deleted. Typed counts the characters you typed regardless of what was deleted, and Time counts writing time instead of characters. The right one is the range, picked from All · 30d · 7d. The device remembers the counting method, so you do not have to pick it again each time you come in.Pasted characters are not counted under any method. Characters deleted after a paste do register on the deleted side, though, so on a day when you brought a manuscript over and trimmed it, Net comes out lower than the work you actually did. A day’s figure never goes below 0.
A year at a glance
Past Year at the top is a grid that paints each day as one square. The more you wrote that day, the darker it gets. Put the cursor on a square and the date, the hours you sat down that day, and the amount appear on one line.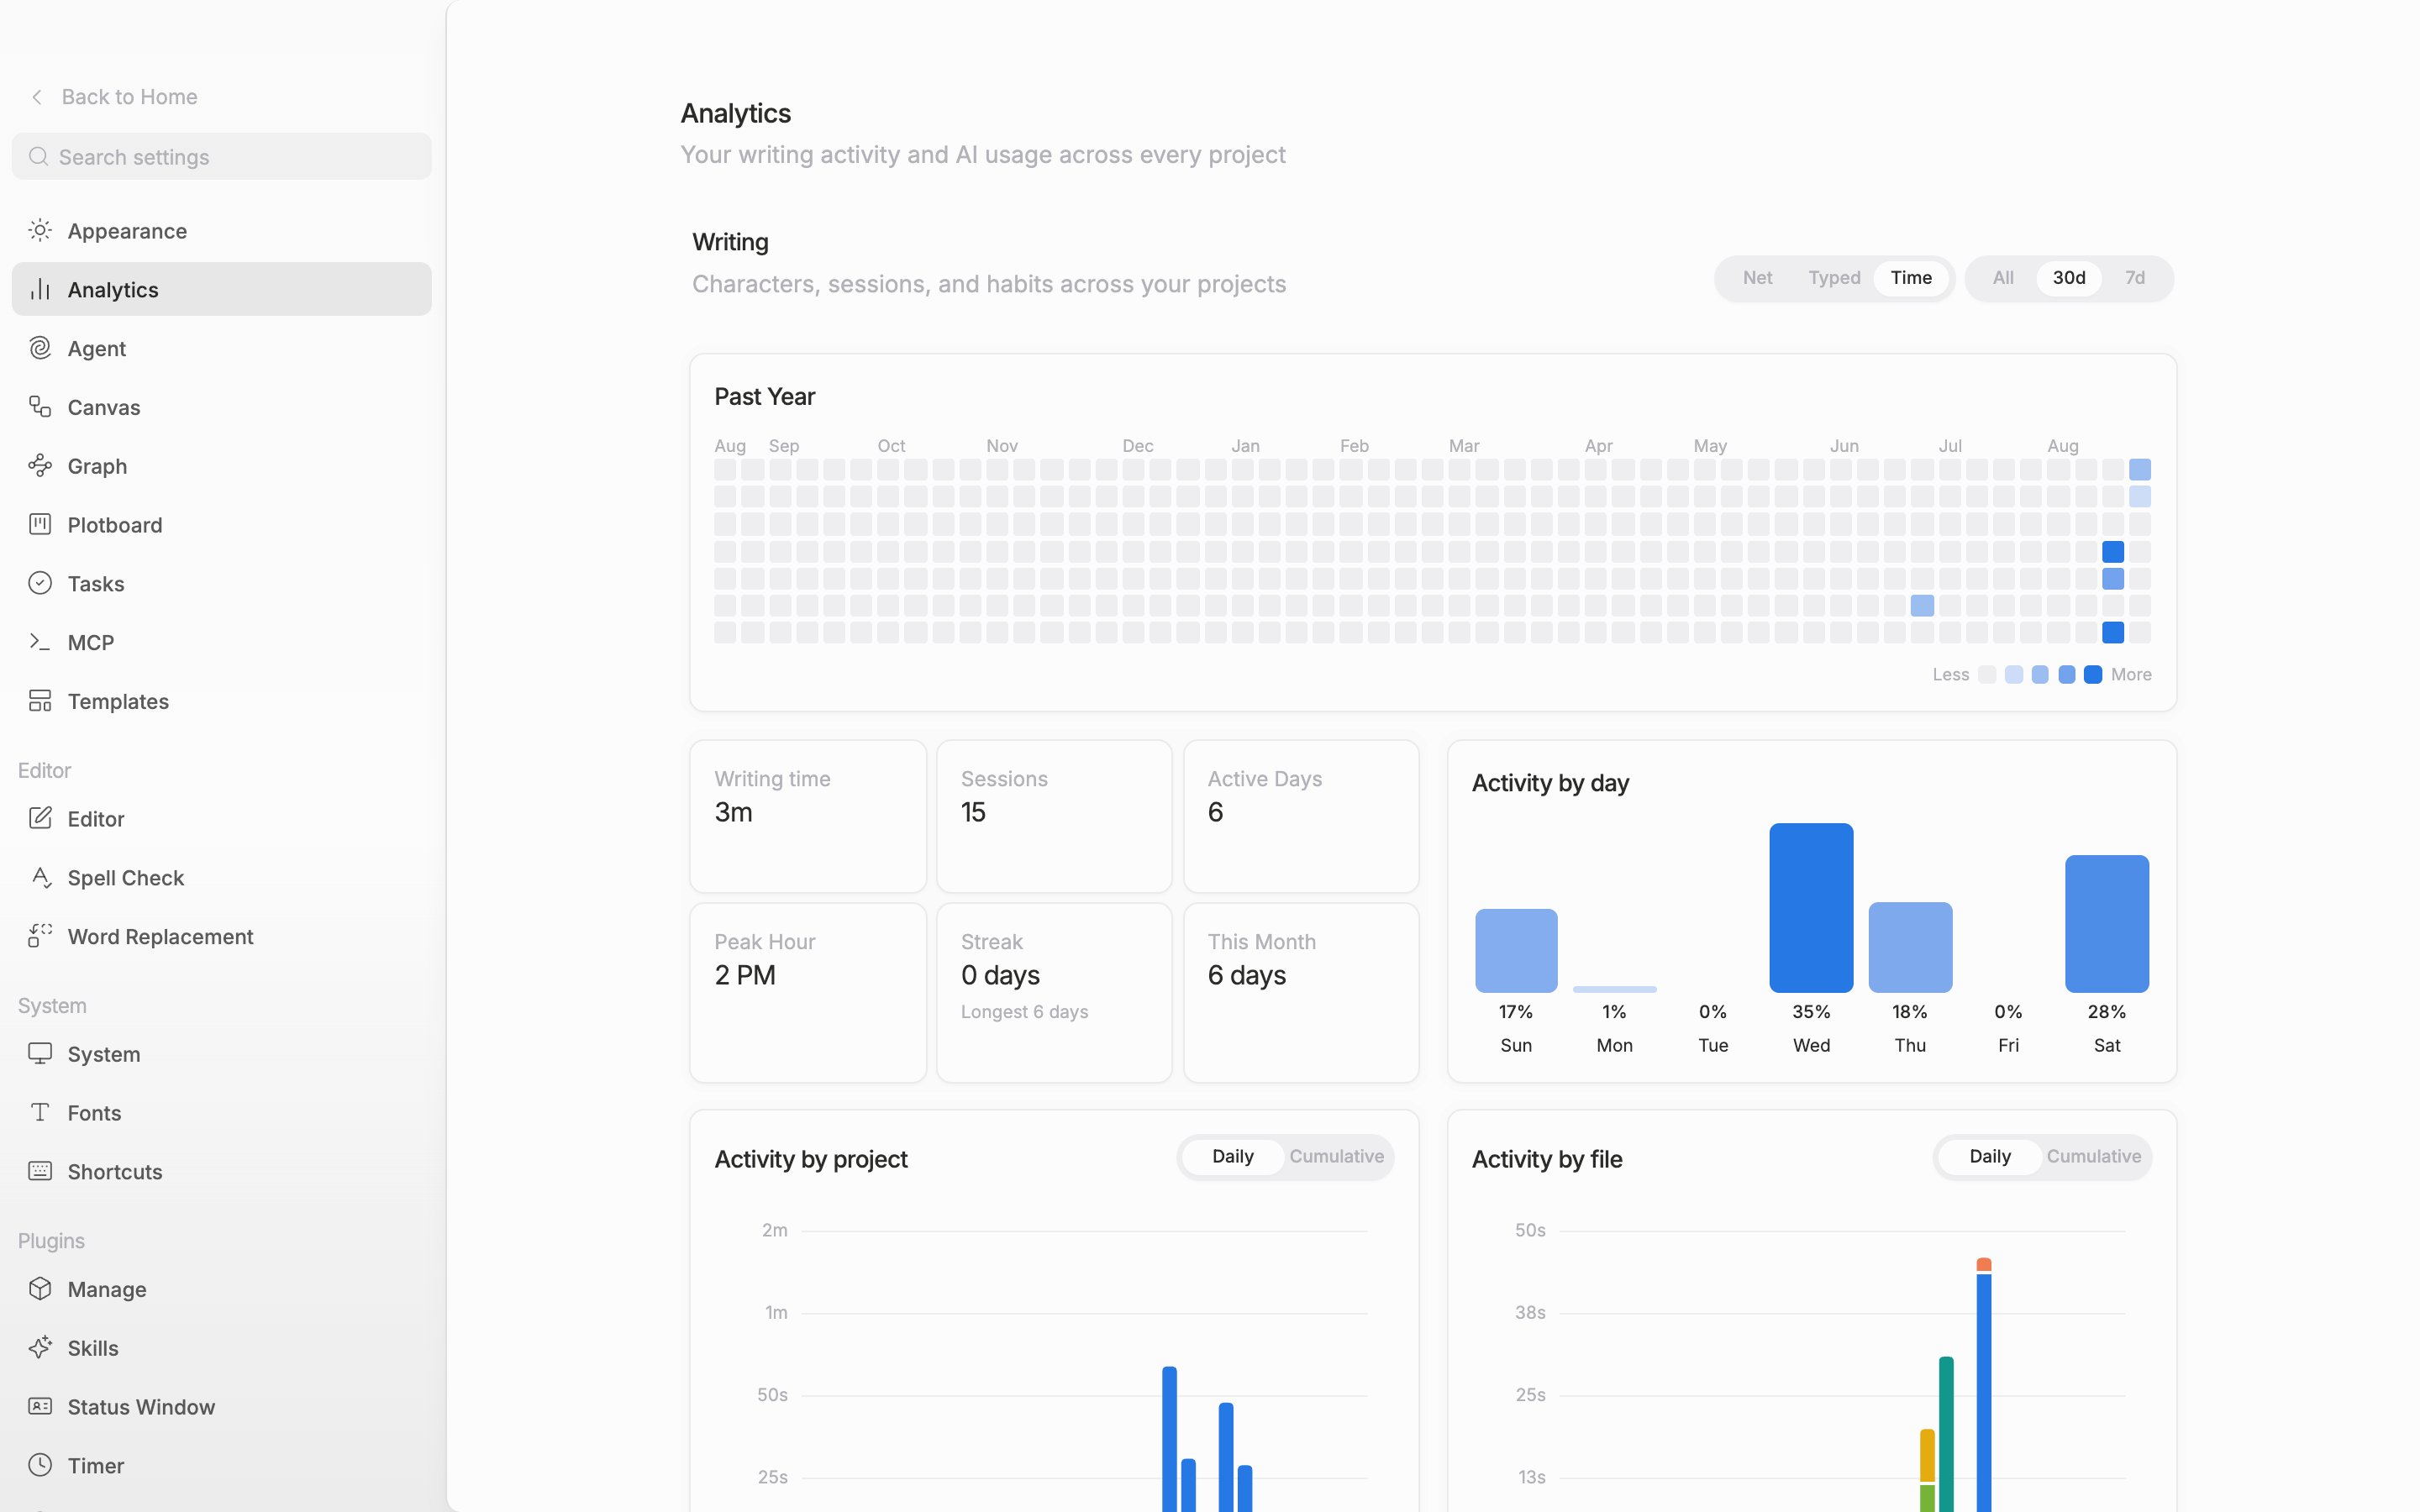
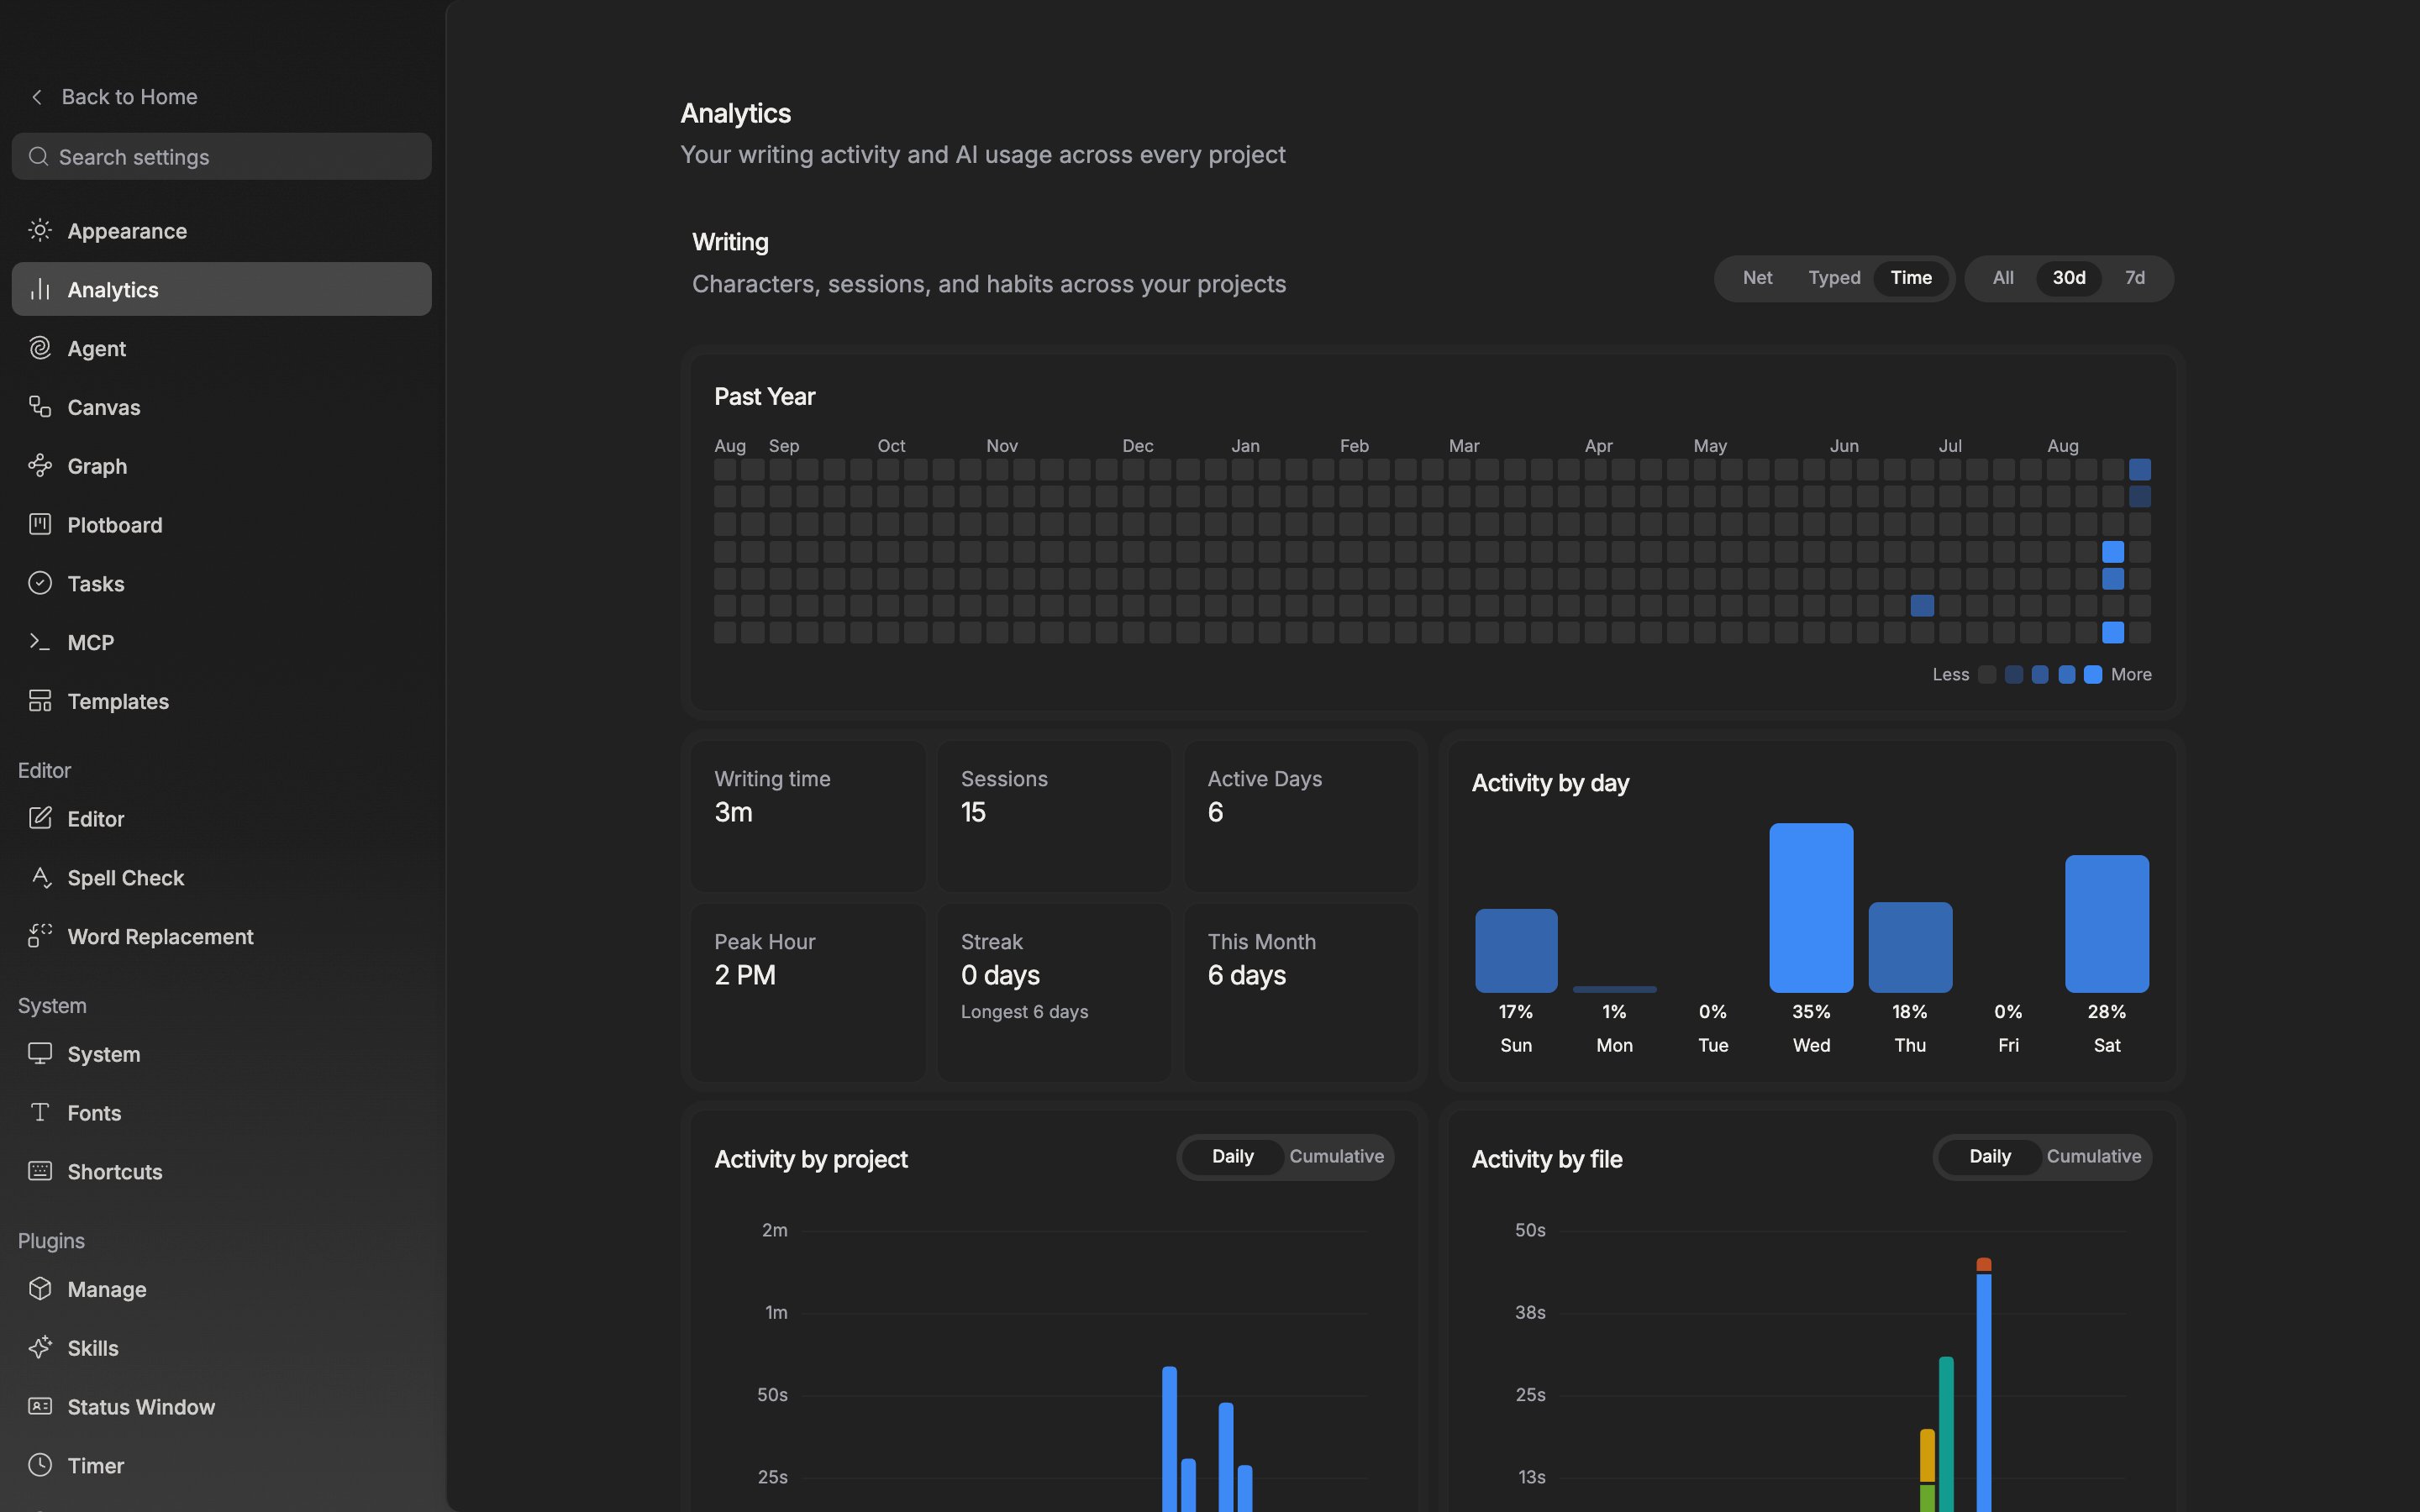
What you pick in the toggles at the top applies to most of the cards below.
Number cards follow below. The name of the first one changes with the method you picked — characters kept, Typed, or Writing time. While characters are being counted, a separate Writing time card is attached. The rest are Sessions, Active Days, Peak Hour, Streak, and This Month. Streak shows the run of days you have kept up to today, with the Longest run in small type underneath. Activity by day on the right shows how much you wrote on each day of the week, as bars and as shares.Where it went
Activity over time is split into two sheets, Activity by project and Activity by file, and each moves between Daily and Cumulative. Share by file type below it is a band divided into Document, Sheet, Canvas, and Plotboard. Top files lines up the files with the most output, from the top down.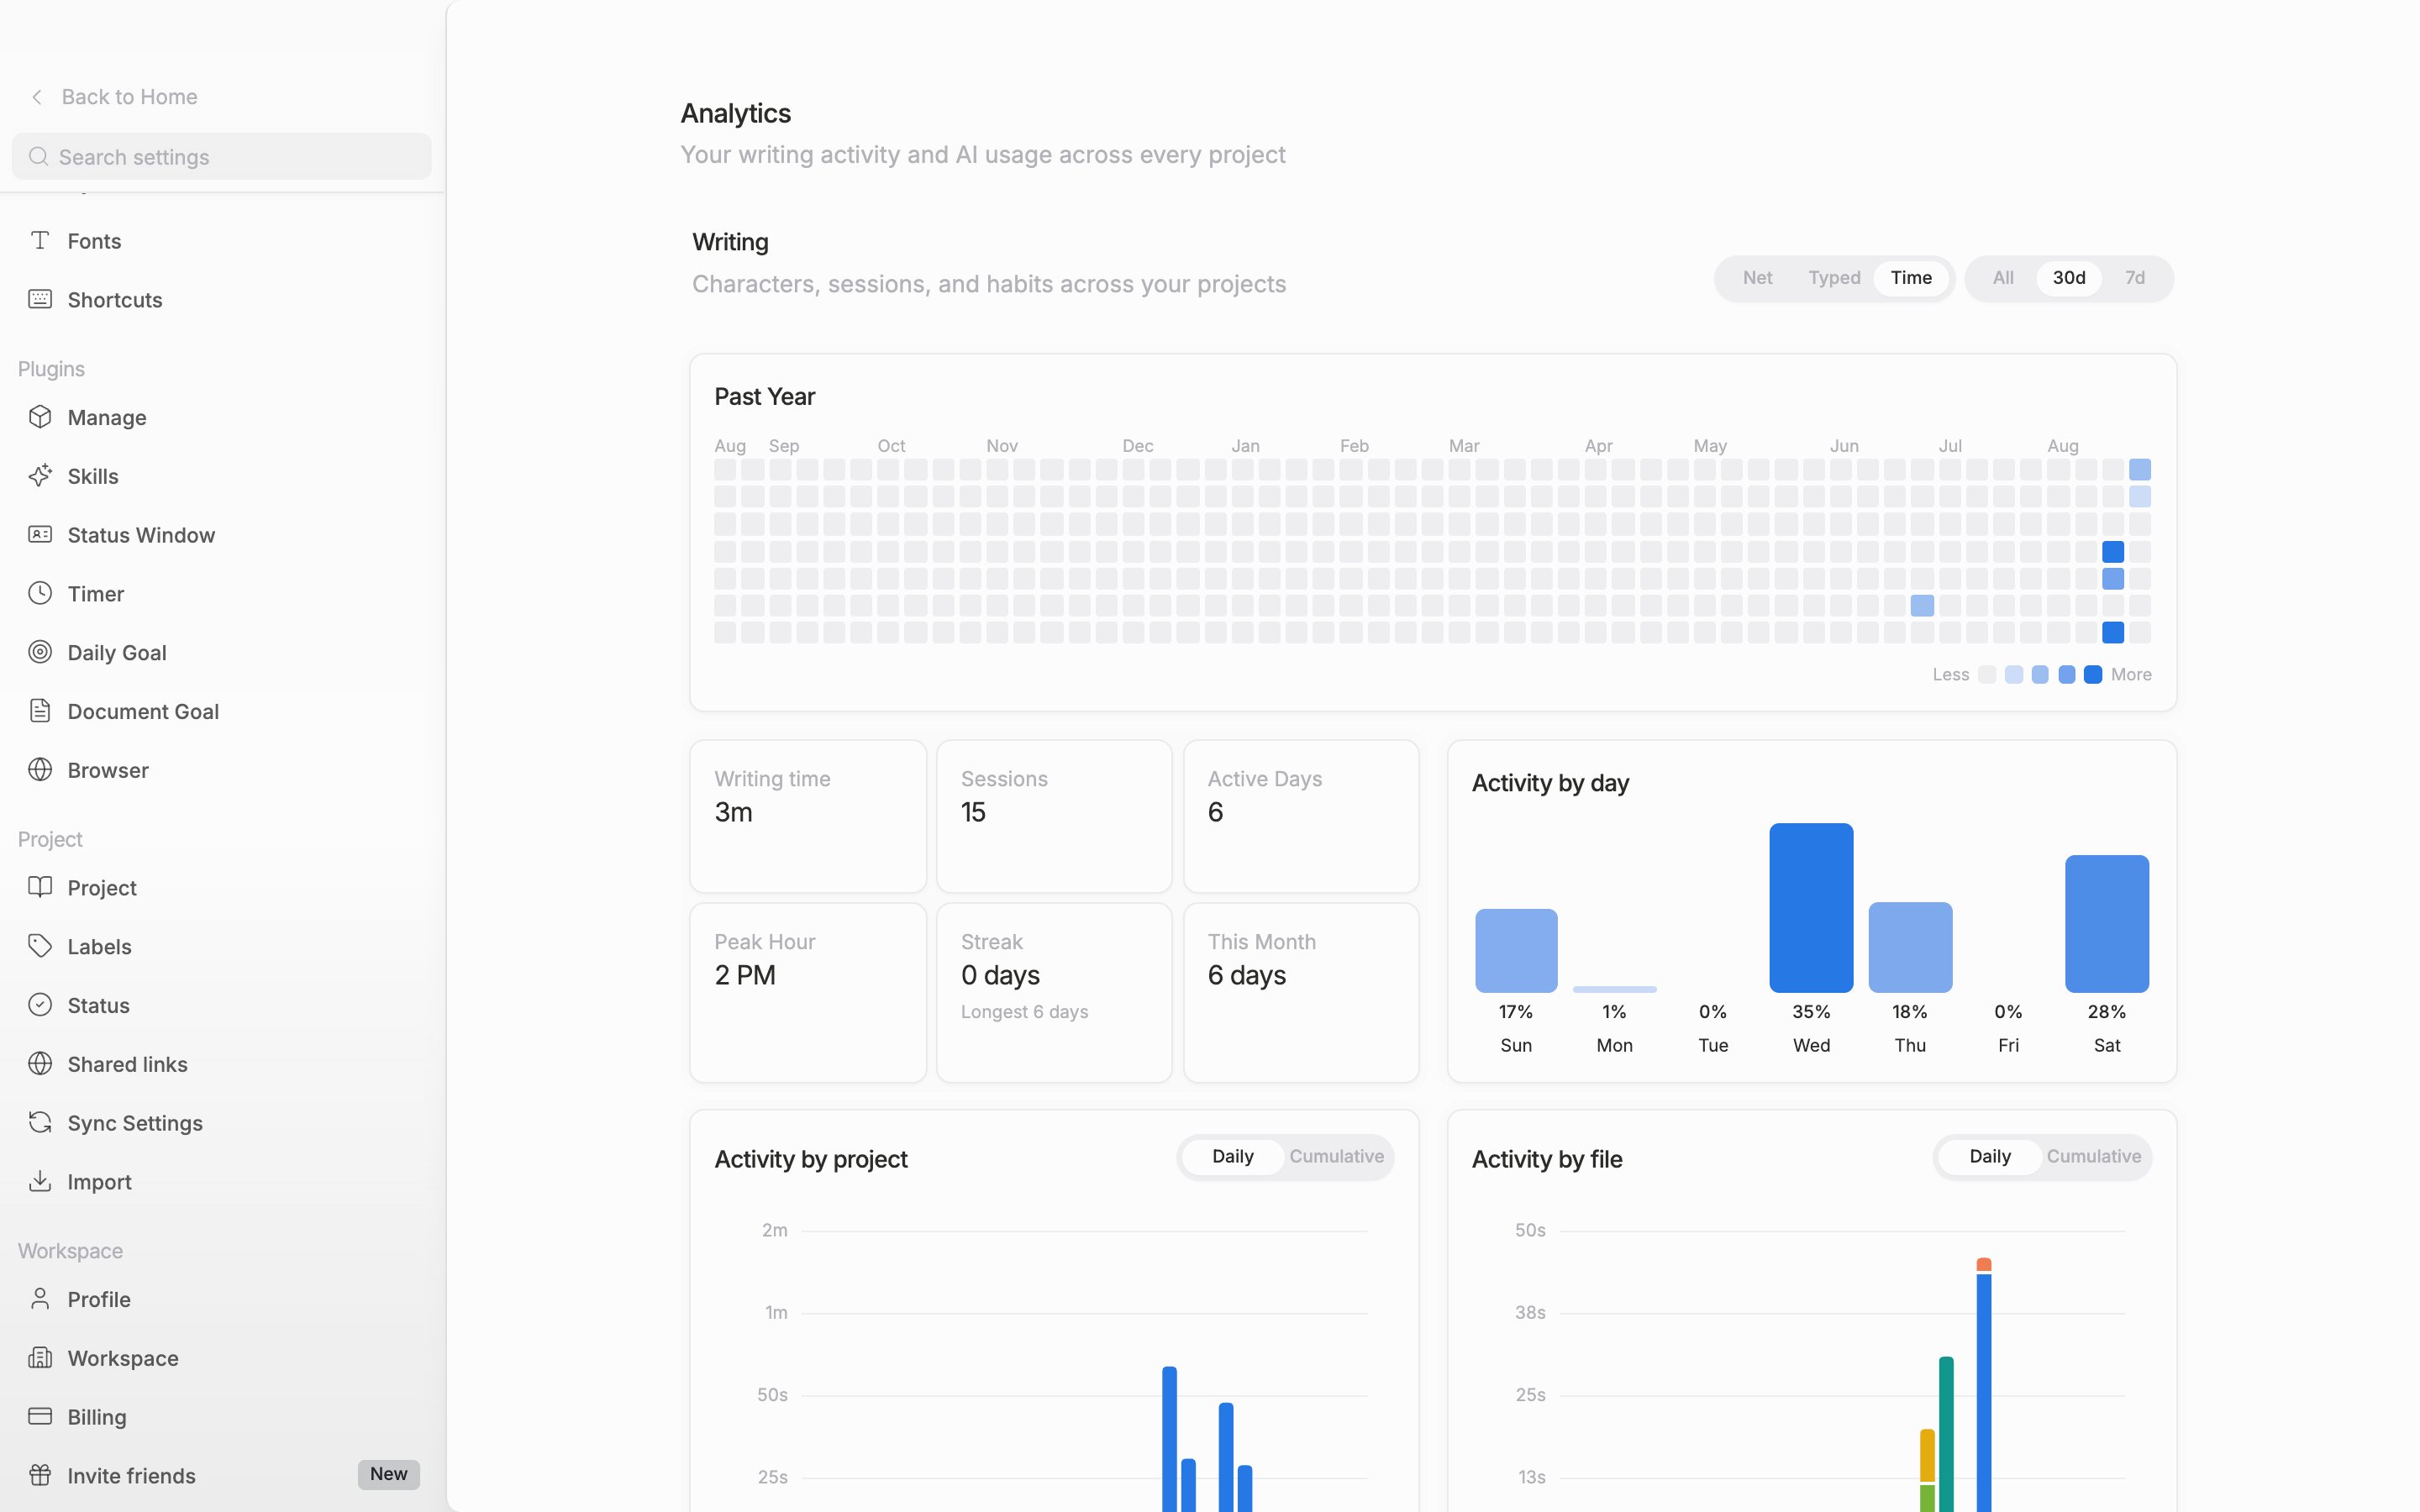
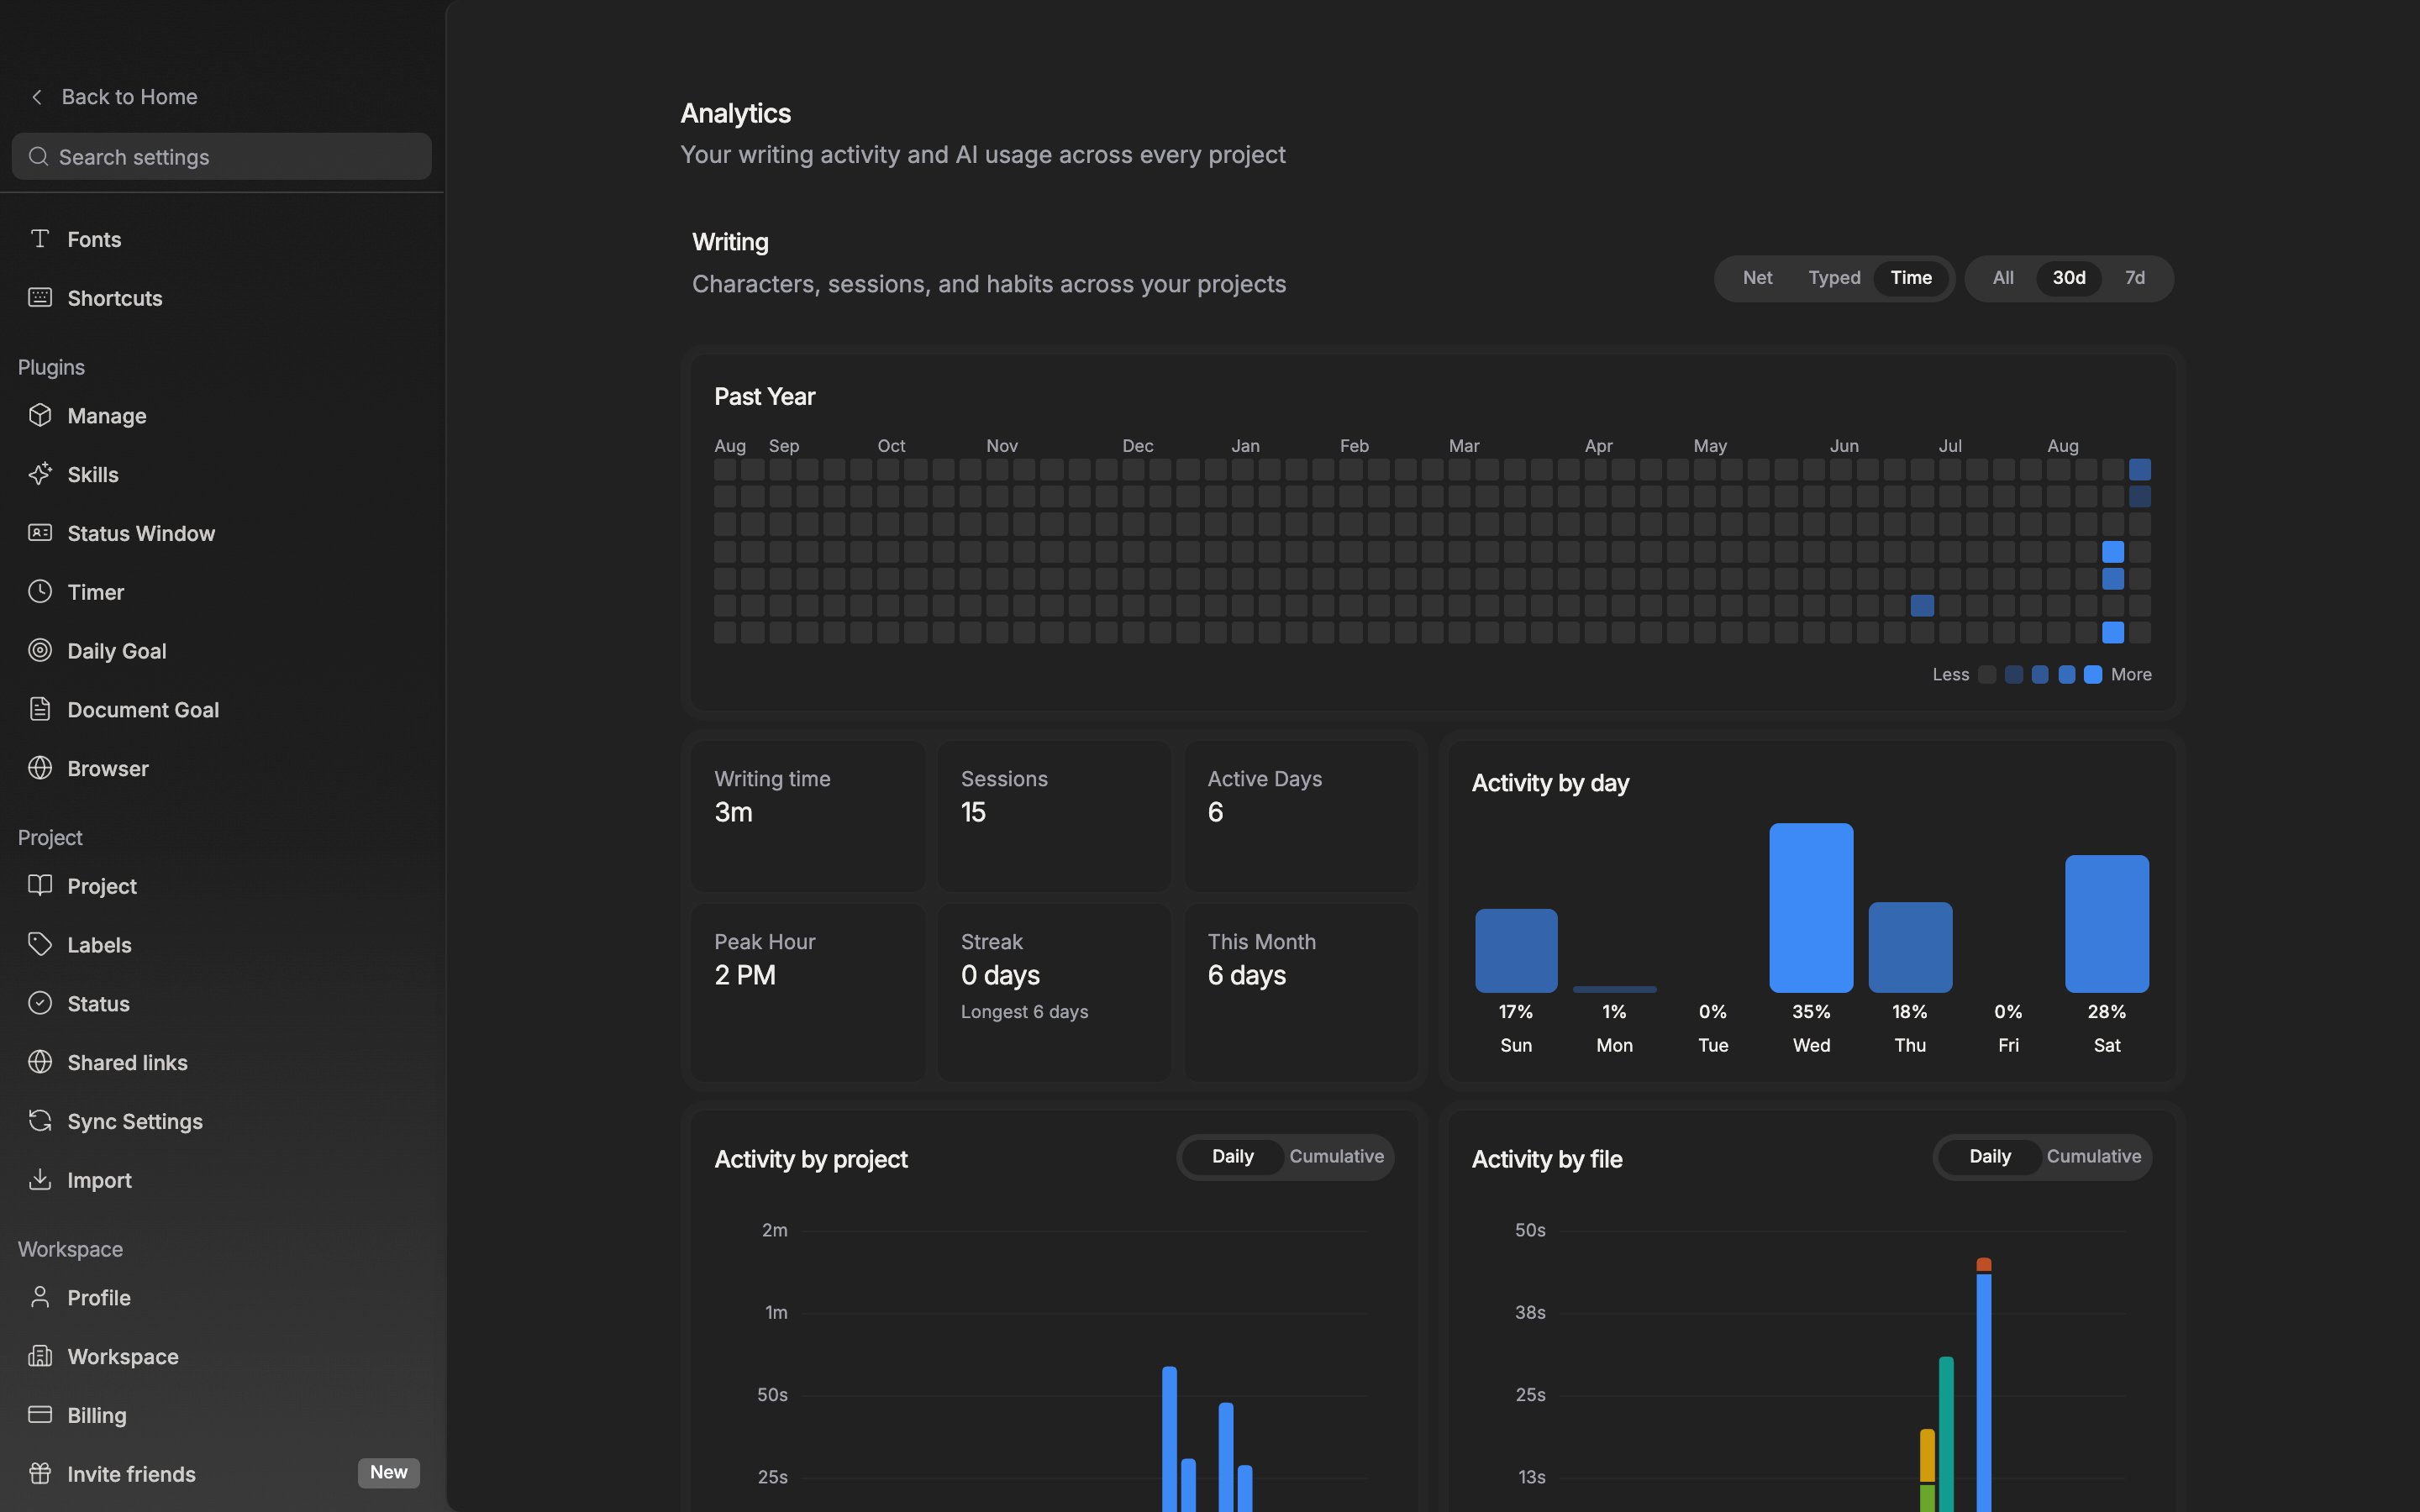
Check here which files the output piled up in.
AI Usage at the very end sorts tokens, requests, and on-demand spend by Model and by Service. If you have not used it yet, only “No AI usage yet” appears.